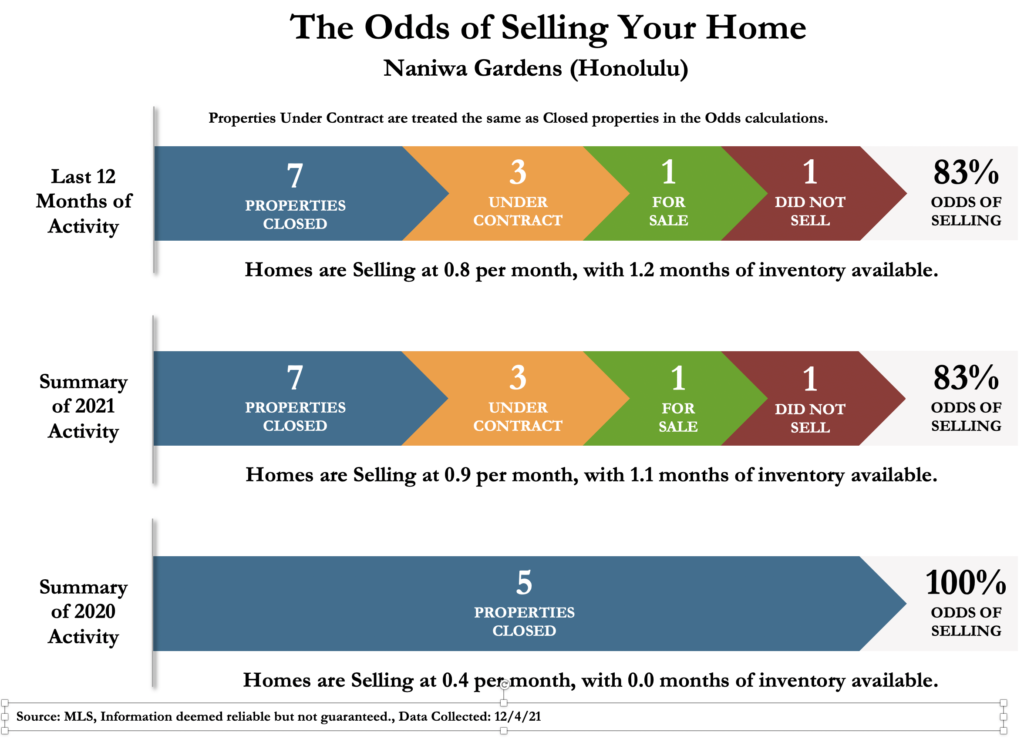
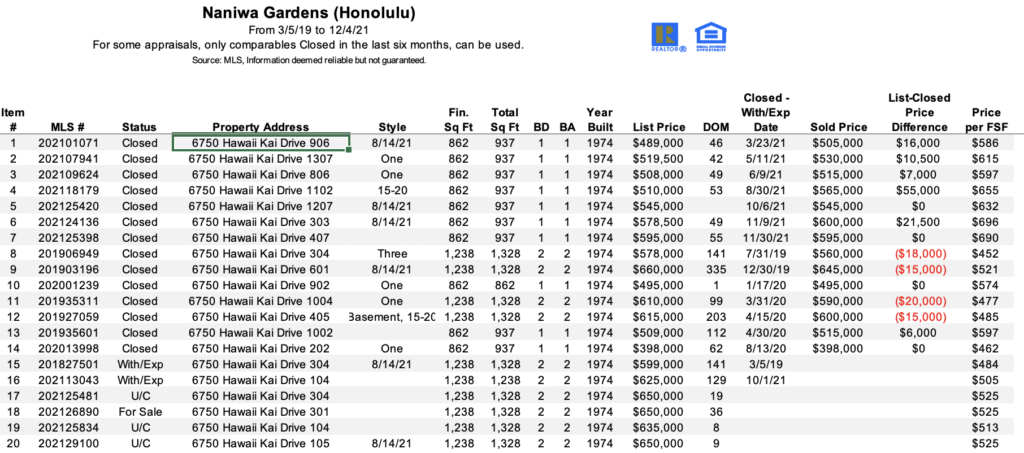
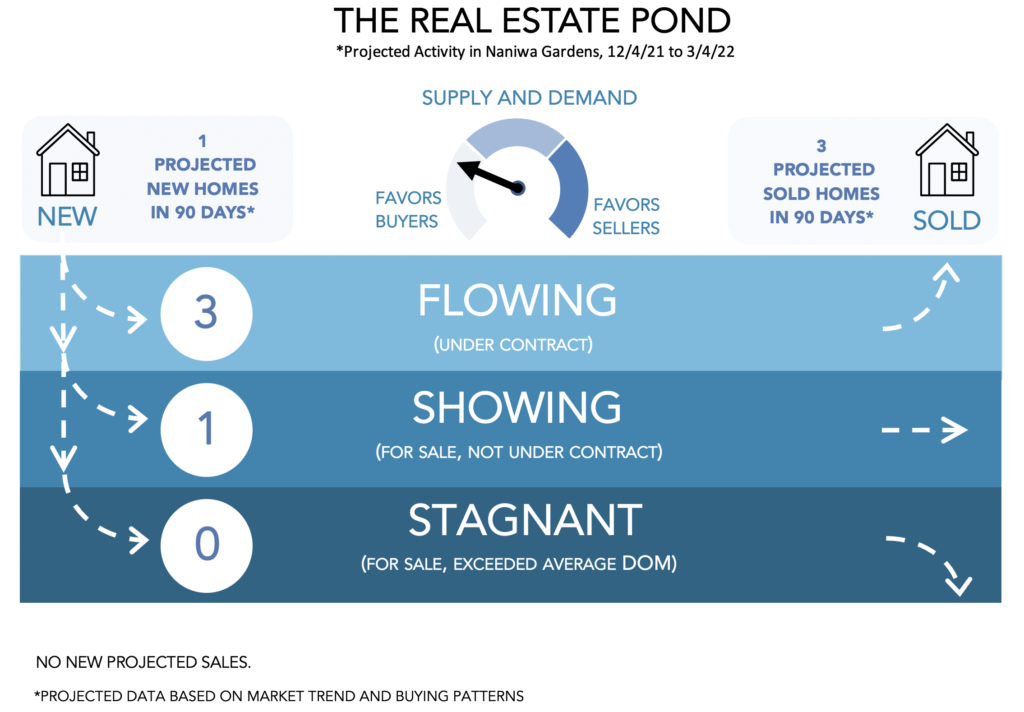
If we look at the Odds of Selling Chart, we can see that in 2020, 5 properties were listed and 5 properties sold = 100% Odds of Selling. In 2021, 7 properties closed, 3 are currently under contract, 1 did not sell and there is one actively for sale. The units are roughly selling at .9/month and there is 1.1 months of inventory on the market. 6 months, is considered a balanced market and less than 6 months is considered a seller’s market.
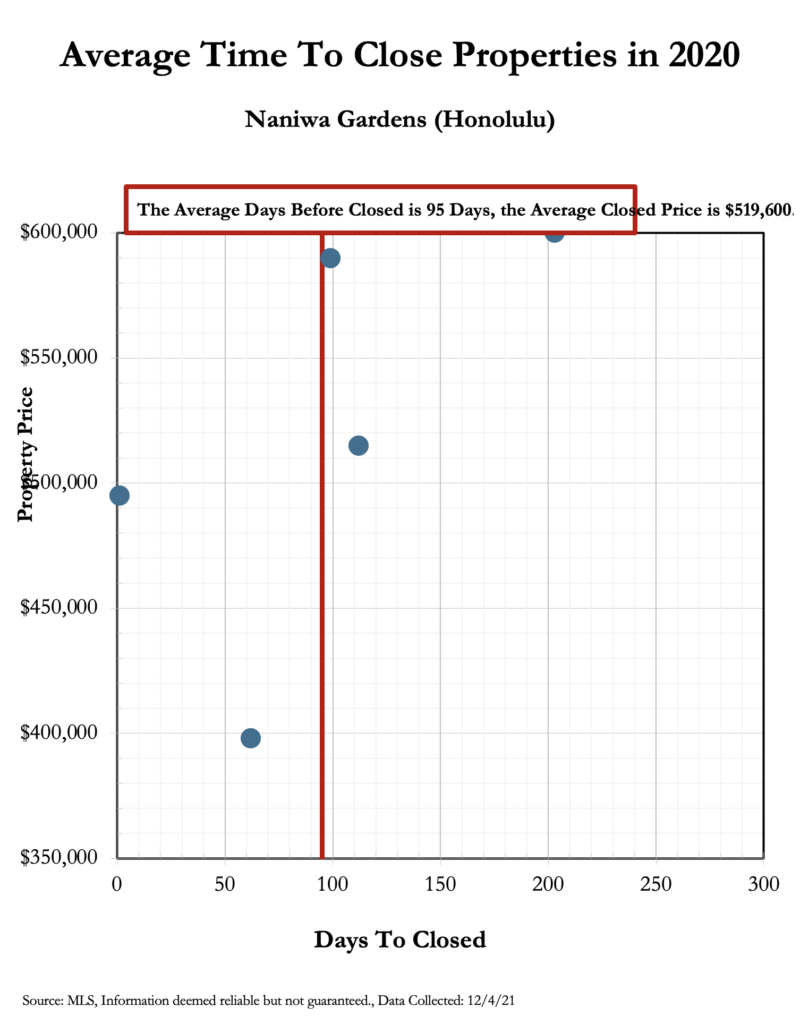
In 2020, it took 95 days, on average to close a Naniwa Gardens unit for an average price of $519,600
In 2021, the closing time was cut in half to 42 days on average to close a Naniwa Garden unit for an average price of $550,714.