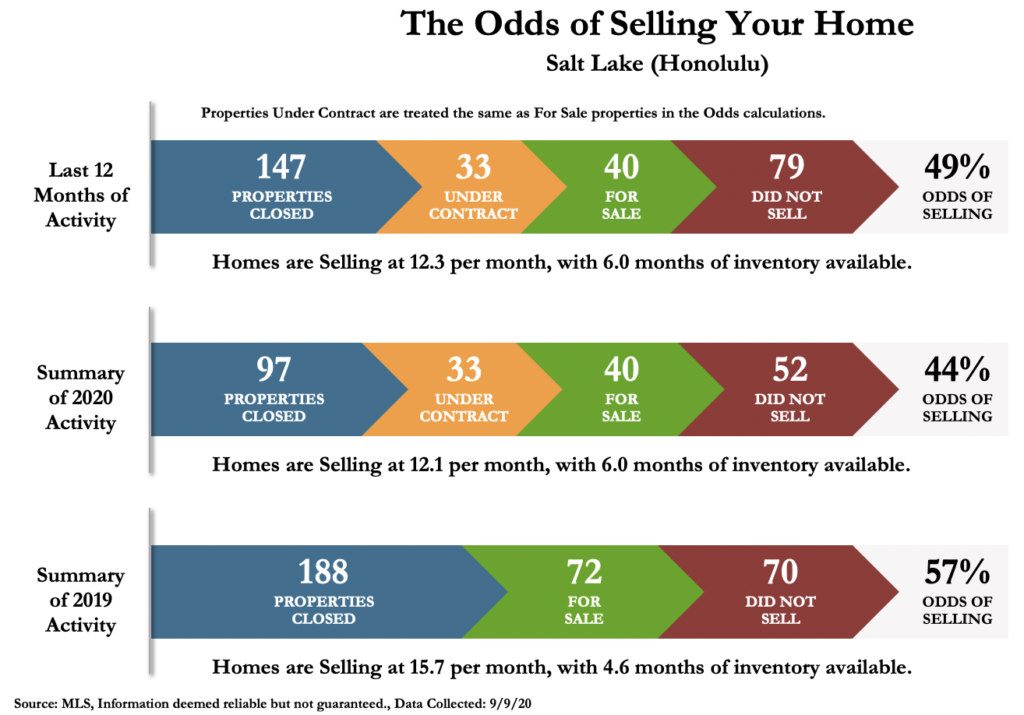
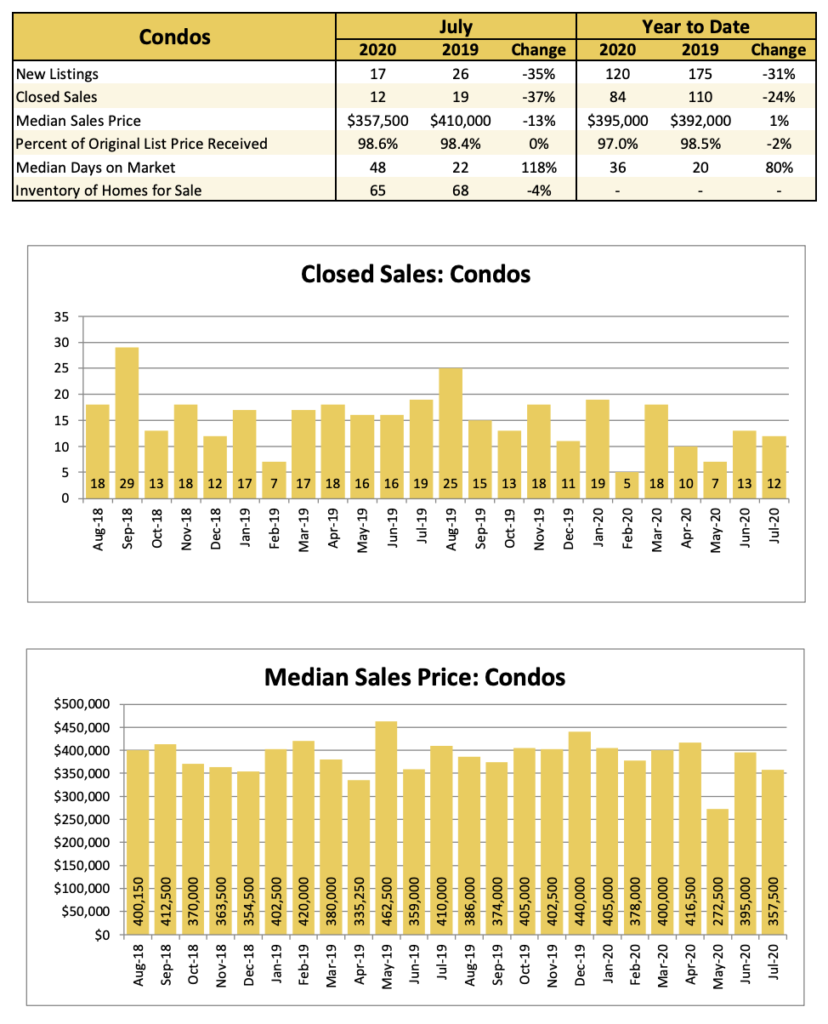
In the past 2 years, there have been 783 units (all sizes) that have come on the market in Salt Lake. In the “Odds of Selling” chart above, we can see that in 2019, there were 188 units sold. At the end of the year, 72 were still for sale. 70 units that were listed in 2019 did not sell. So far, in the first 8 months of 2020, closings are half of what we saw in 2019 (97 vs 188). In the chart below, we can see all of the activity thru July, 2020.
Under “Closed Sales: Condos”, We can see that this years April and May closings were cut in half, year over year (from 16 & 18 closings to 10 & 7 closings), but June and July have rebounded nicely.
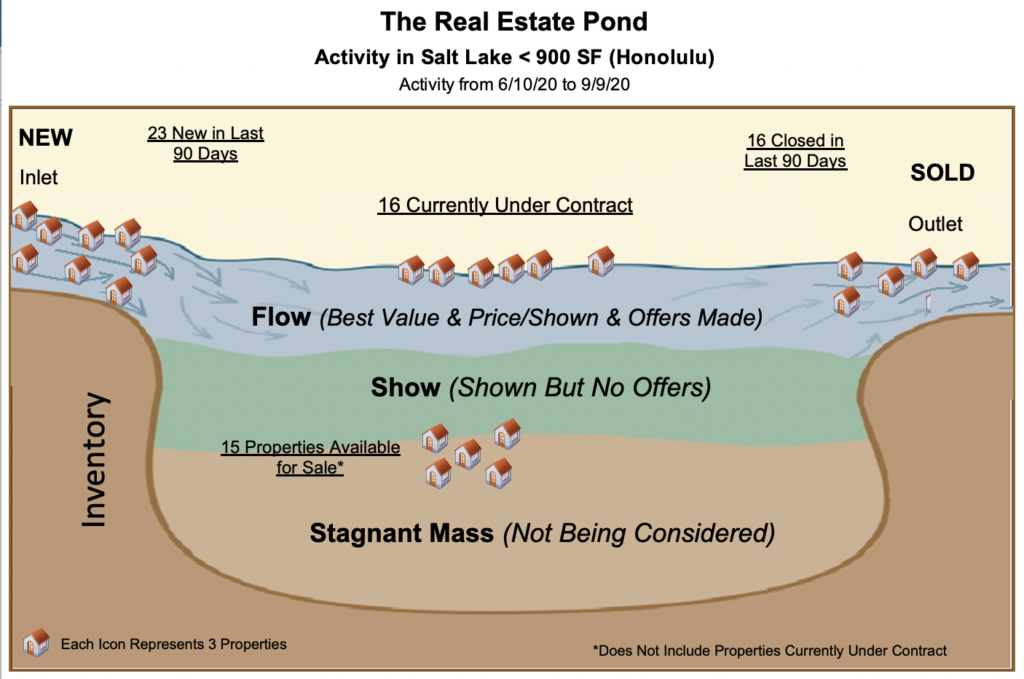
In this pond chart, we are only looking at the last two years, or 314 transactions, that were 2 bedroom, Salt Lake units under 900 SF. This basically excludes larger 2 bedrooms and units in the Plaza Landmark, Country Club and Century West, which have resort-like amenities, gated parking and routinely sell for $100k over Fairway Gardens. On the left side of the chart, we see water (or listings) flowing in to the pond. The water entered the pond at a rate of 23 new listings, over the past 90 days. Currently there are 15 active listings in the pond and 16 condos that are in escrow and about to exit the pond to the right. Over the past 90 days, 16 condos have exited the pond and sold. Our goal is to be one of the new listings that enter the pond, we want to find a buyer, go into escrow and be one of the 16 that exit the pond as a closing. We don’t want to be one of the 15 properties that sinks down in to the pond and gets stuck in the “stagnant mass”. If you become part of the stagnant mass and you are one of those 15 condos, that are not selling, you have two options; 1) reduce price and/or 2) add value. The stagnant mass condos came on the market with the wrong mix of preparation, marketing and pricing. If we are well prepared, well marketed and well priced will sell the condo for the most amount of money in the shortest amount of time.
The financial stress index has returned to “normal levels” since its highs of March, this year, around 5 points. In the chart, you can see the all time high of 9 points in October of 2008, during the financial crisis.
We can see Hawaii’s economic activity has improved since the lows of 61 points, in May, to 82 points, in July.
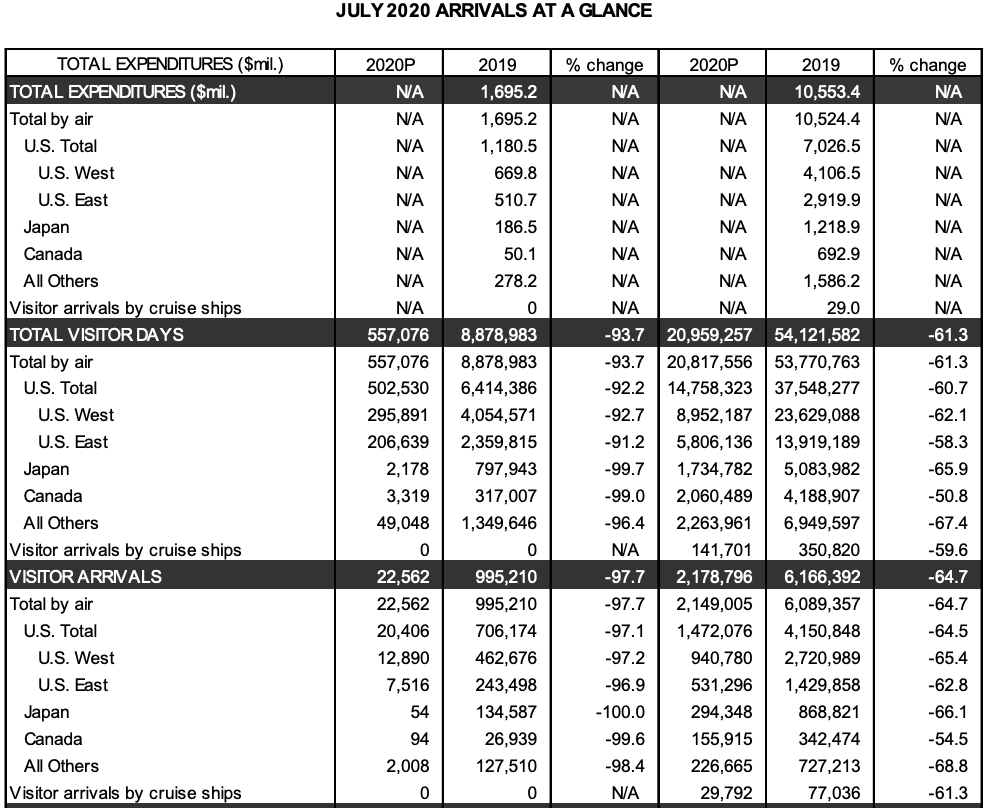
Tourism numbers are still cratering
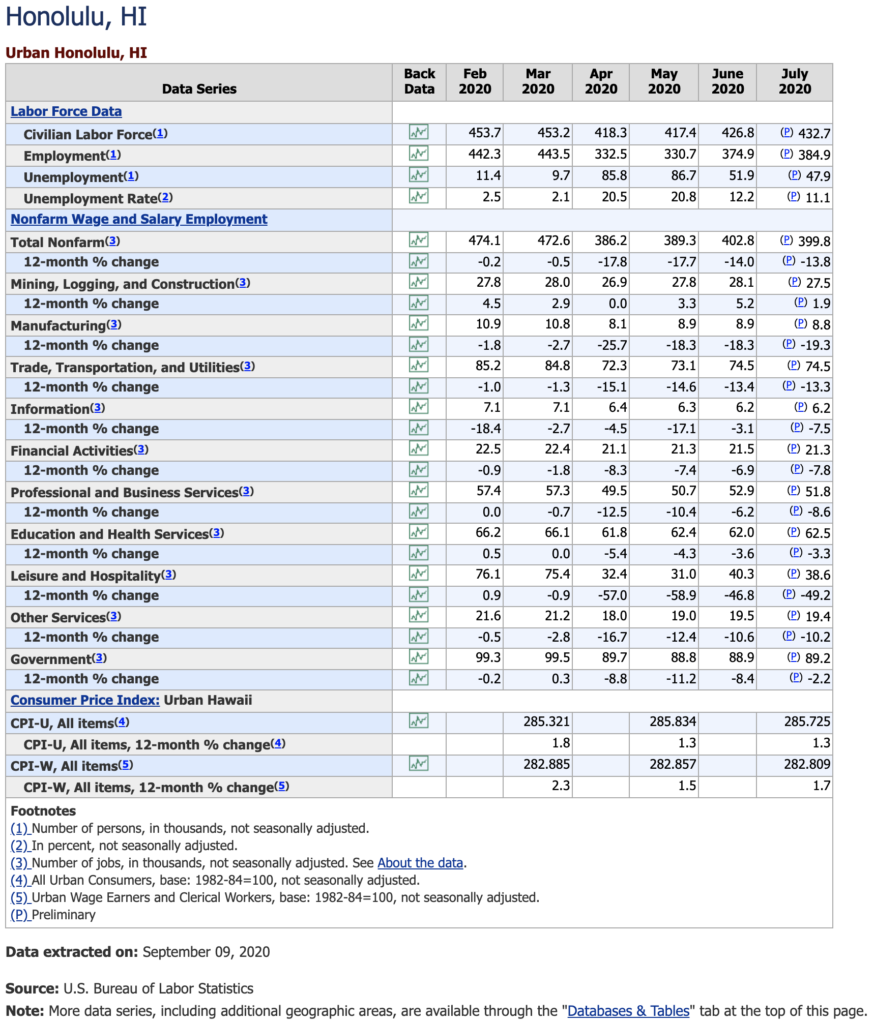
Labor numbers still depressed, especially in Leisure and Hospitality (-49.2%)